
Corporate project · Industrial manufacturer · In use
Shipment Planning Dashboard and Live 3D Dispatch Yard
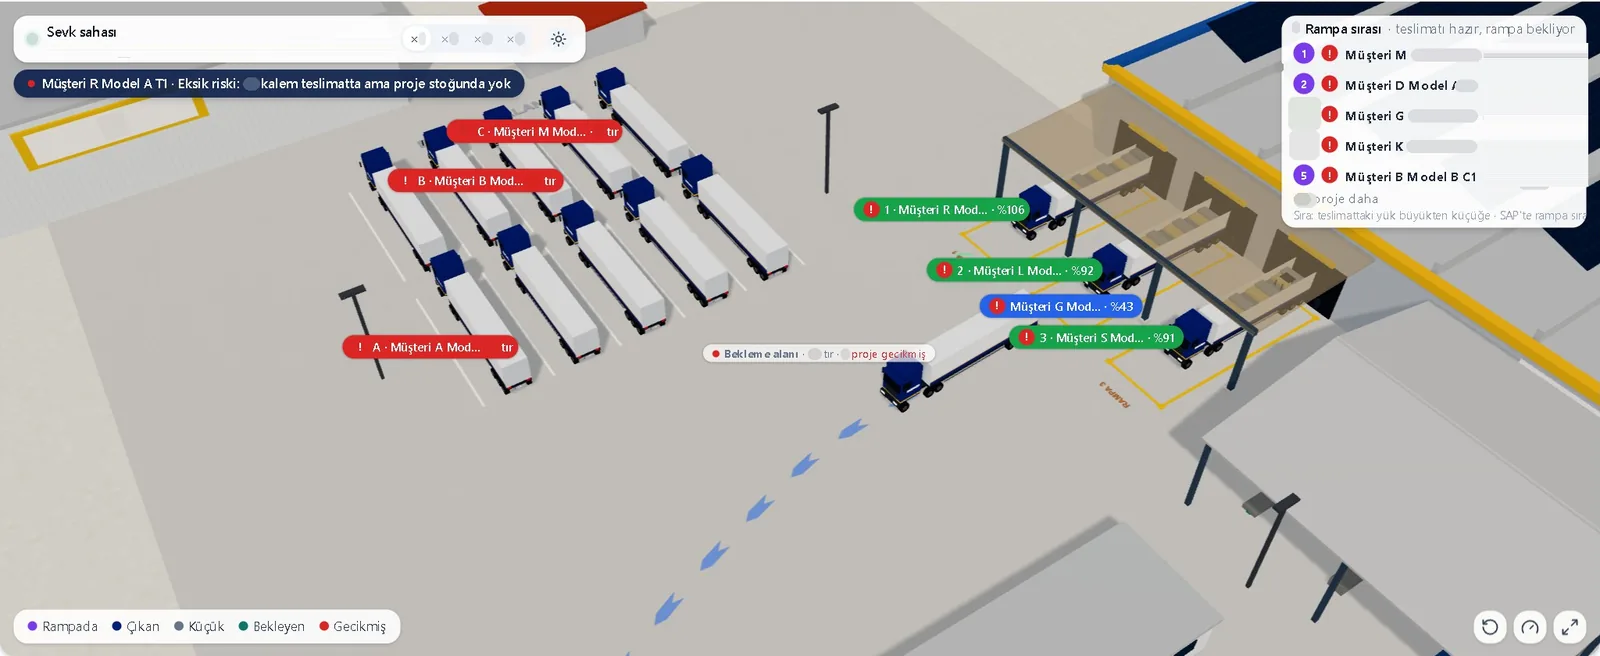
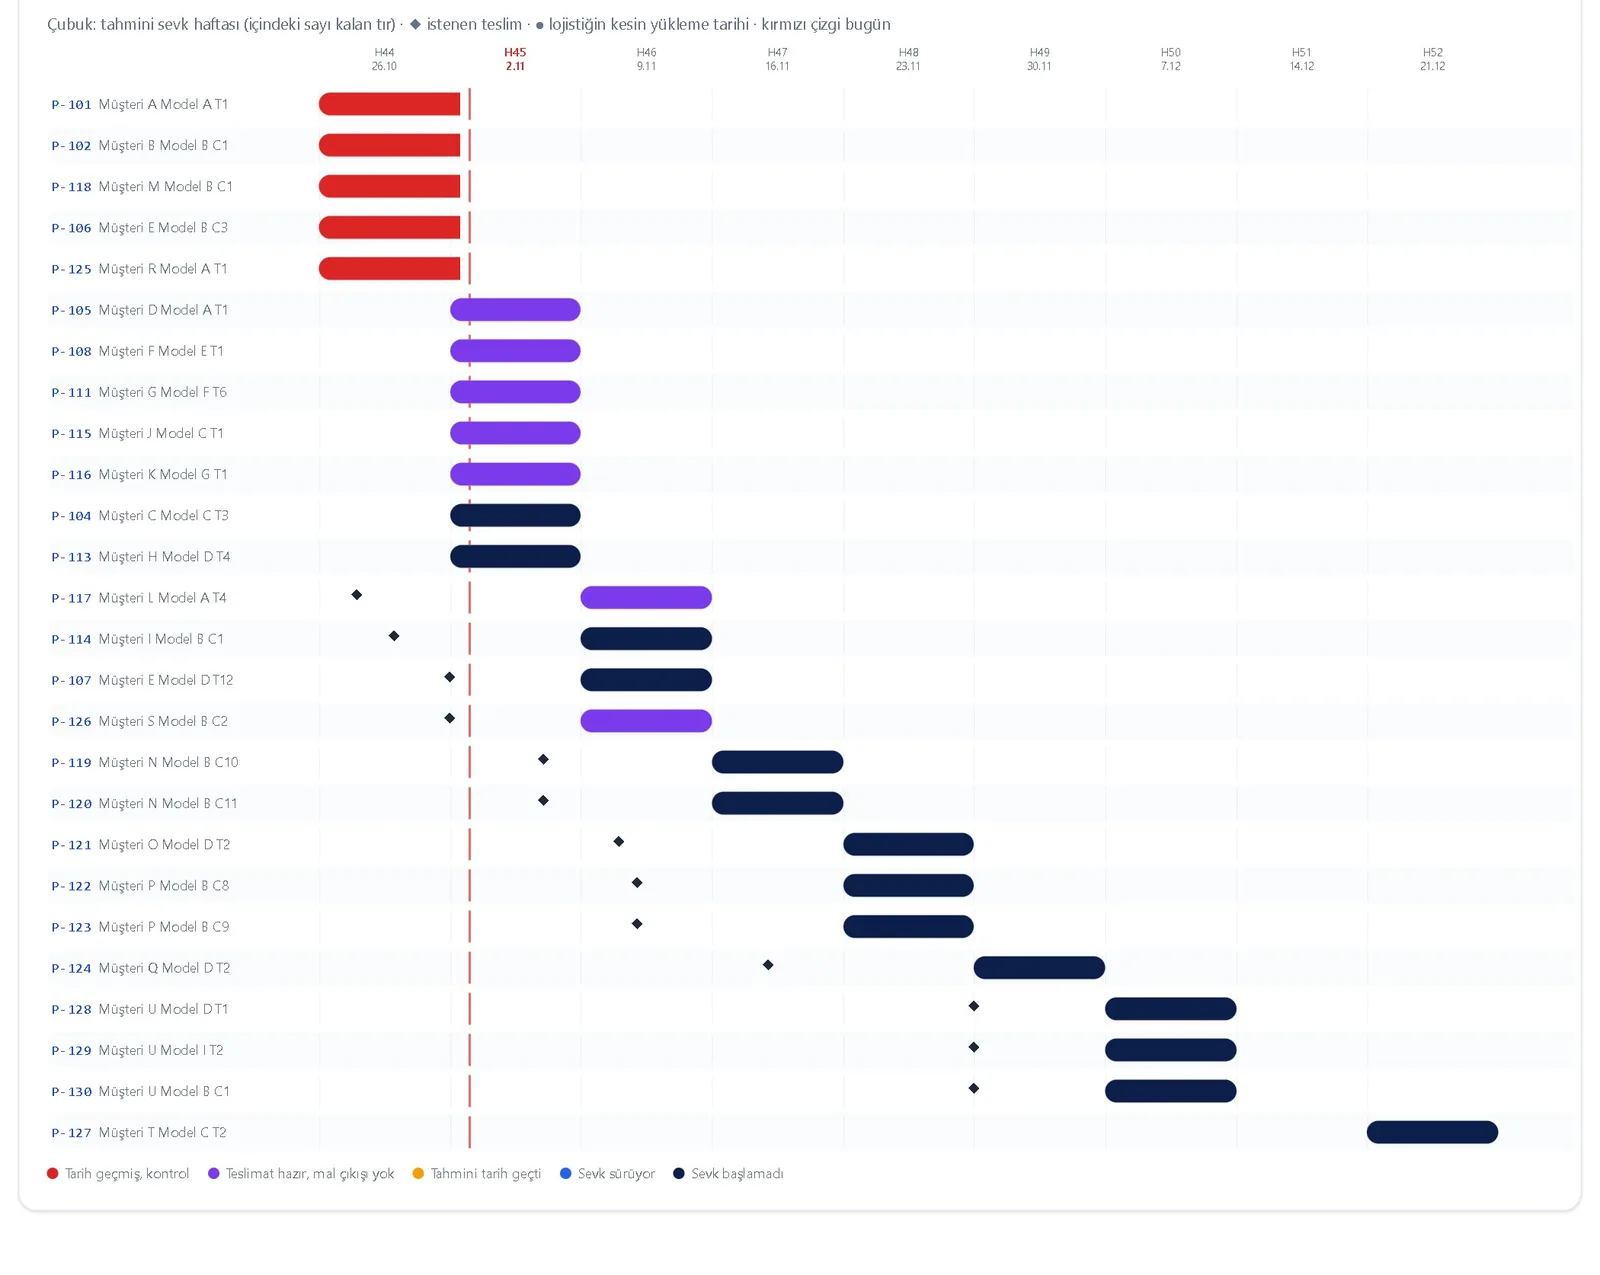
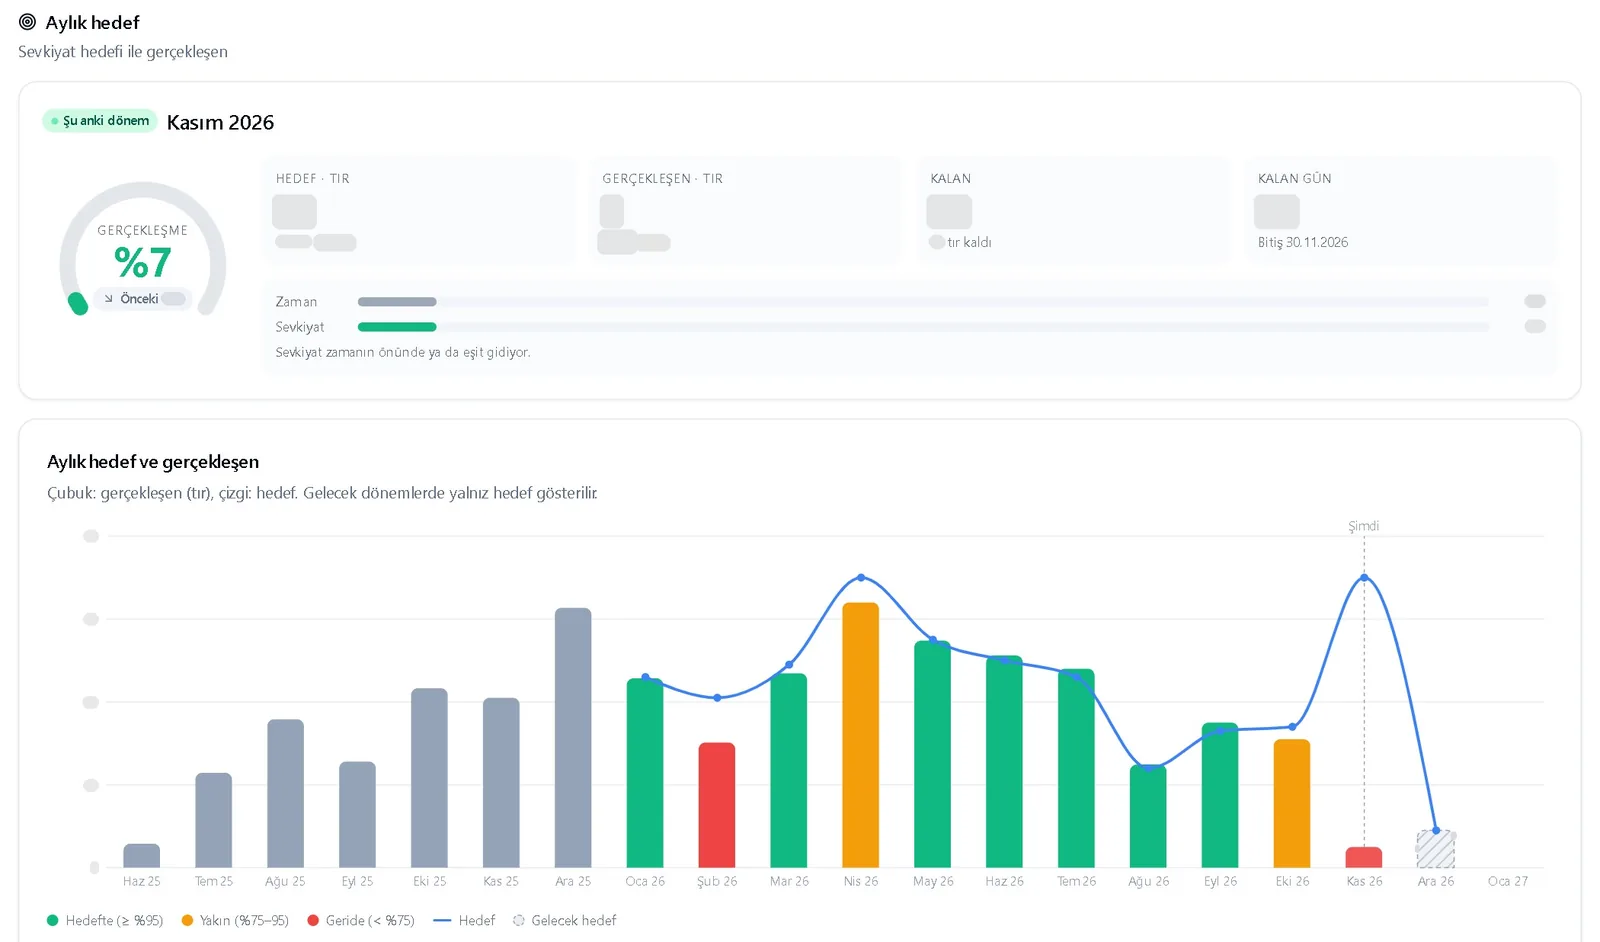
A logistics dashboard that estimates the trucks per project, compares the monthly target with actual shipments and shows the plant's dispatch yard live in 3D. Data comes straight from SAP, read-only.
- Dashboard
- SAP / ERP
- 3D & interactive
- Web app
- Live SAPread-only, nothing written
- 17 monthsof history to browse
- ×1 ×2 ×4dispatch-yard simulation speed
- 330–414 → 94–120draw calls in the 3D yard after merging the scene
- 1SAPLive data, read-only
- 2Snapshot storeSQL, refreshed on a schedule
- 3PlanningTrucks · target vs actual
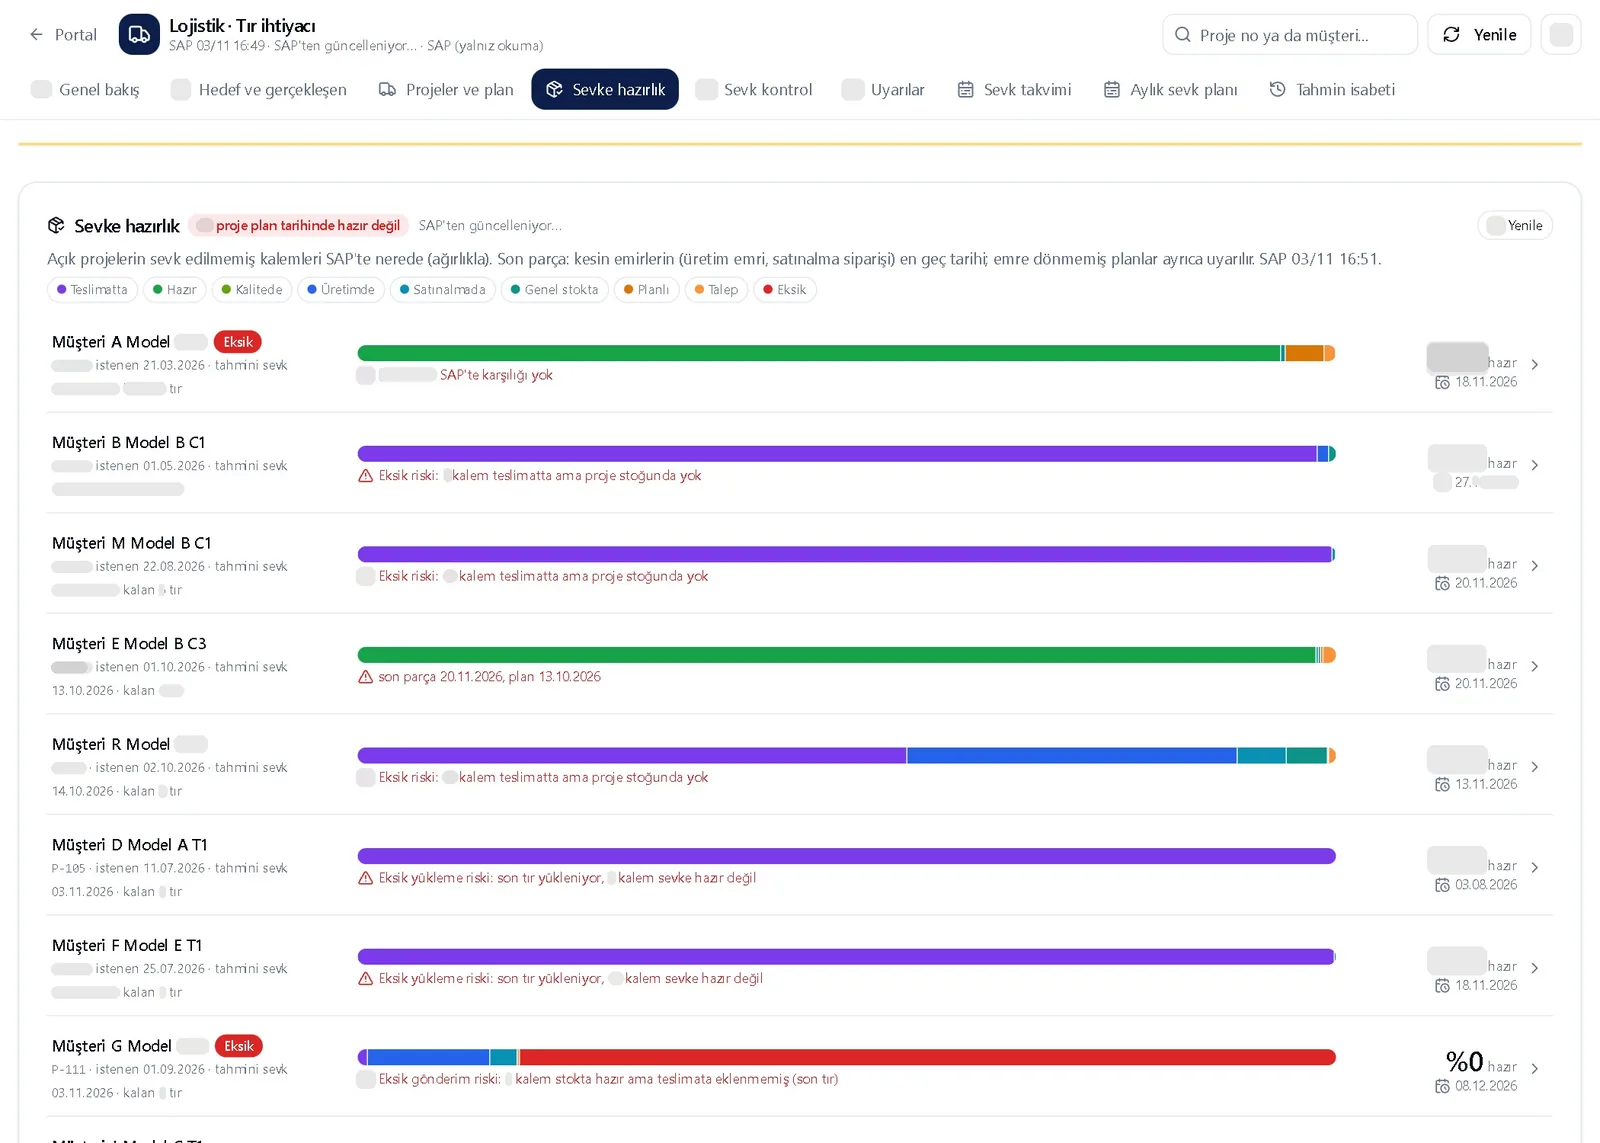
- 4ReadinessWeighted by kg
- 53D dispatch yardLive status labels
Built for an industrial company. For confidentiality, the company name, logo, product/part codes and internal data are not shared; images are cropped accordingly. Customer, project and model names and document numbers have been replaced in the images; figures that show business volume are hidden. The flow diagram is illustrative.
The need
How many trucks each project needs, how much of the monthly target was met and what was ready to ship were tracked in hand-kept spreadsheets. Missing items were later re-sent free of charge, and that cost stayed invisible.
The solution
- Trucks per project: the logistics team's own spreadsheet rule and the system's estimate are shown side by side.
- Weekly and monthly target vs actual, the largest deviations and past months.
- Shipment readiness is weighted by kg; an item counts as ready only if project stock covers it.
- A report of items re-sent free of charge, with their estimated monthly cost.
- A 3D dispatch yard built from drone video and photos: loading bays, weighbridge, waiting area; trucks carry live status labels (loading, queued, delayed, on the weighbridge, departed); clicking a truck opens its readiness and risk card.
- Warehouse (EWM) flow: which project's materials reached the shipping area today.
- A one-screen summary for management, role-based views, no horizontal scrolling on phones.
- Nothing missing from SAP was invented: the yard layout is labelled illustrative, and the ramp-queue card says plainly that SAP does not record a queue.
Delivered
- Live web dashboard
- SAP read service (ABAP RFC)
- User training screens
- Check scripts
Technologies
- Next.js 14
- React
- TypeScript
- Three.js
- SQL Server
- SAP ABAP RFC (SOAP)
- SAP EWM
- PowerShell